
Your AI app answered a user question with nonsense, and nobody can say why. The model is non-deterministic, the prompt changed three times, and the request took four seconds. Langfuse’s documentation puts it bluntly: debugging a generative AI system without observability is closer to guesswork than to engineering.
Three tools dominate this space for LLM applications, and they fail in different directions. LangSmith is built for LangChain and LangGraph apps. Langfuse is open source and self-hostable. Helicone works as a gateway in front of your model providers. Here is how each one actually works, and where each one fits.
Why LLM Apps Need Their Own Observability
Traditional application monitoring watches a system that behaves the same way twice. LLM applications do not. The same prompt can produce a great answer on Tuesday and a hallucinated one on Wednesday, so “the endpoint returned 200” tells you almost nothing about quality.
Helicone’s platform documentation lists the four problems that show up in production LLM apps: provider outages that break your app with no visibility into failed requests, unpredictable costs, debugging issues that cannot be reproduced, and prompt changes that force a deployment because there is no version control. Each of the three tools exists because of that list, but each one attacks it from a different angle.
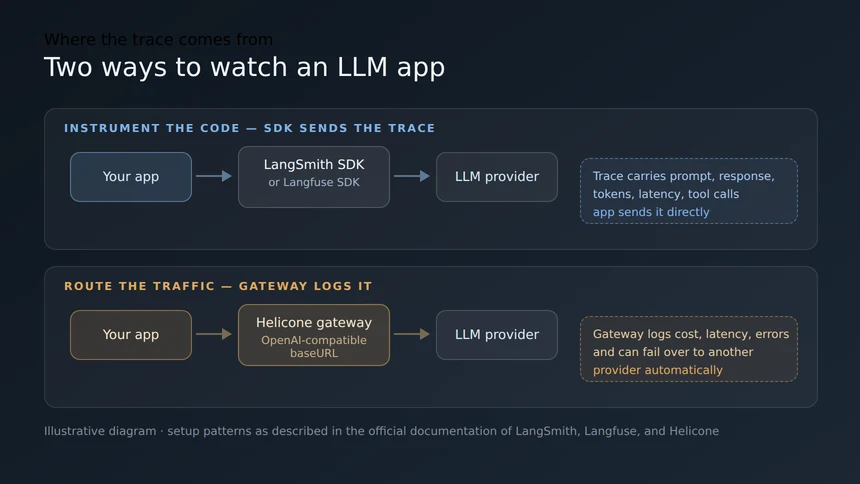
What they share is the same foundation: a trace, meaning a structured record of one request that captures the exact prompt sent, the model’s response, token usage, latency, and any tool calls or retrieval steps in between. Langfuse calls this application tracing, and adds that it also gives evaluations real production traces to run on. The difference between the three is where the trace comes from and what you can do with it once it lands.
LangSmith: Tracing Built Around Agents
LangSmith, from the LangChain team, organizes observability data in four nested concepts. A run is one unit of work, such as calling an LLM, formatting a prompt, or retrieving documents; the docs note you can think of a run like an OpenTelemetry span. The runs for a single operation form a trace, a tree of work. A thread links traces from one multi-turn session together. A trajectory flattens that thread into an ordered list of messages, which is handy when you want to read what was exchanged without the execution detail.
Each trace is limited to a maximum of 25,000 runs, after which additional runs are rejected. Setup is minimal when you are already in the ecosystem: the tracing quickstart shows you setting LANGSMITH_TRACING=true and a LANGSMITH_API_KEY environment variable, and a single flag is enough if you build with LangChain or LangGraph. Dedicated wrappers exist for providers such as Anthropic and Google Gemini, and accounts outside the US region need the matching regional endpoint.
The strength here is depth. When an agent calls a model, runs a tool, and calls the model again, LangSmith shows the whole tree, with timing and nesting intact, which is exactly what you need when an agent looped three times instead of once.
Langfuse: Open Source Tracing With Evaluations
Langfuse takes a broader definition of its job. Its observability overview argues that a purpose-built LLM tool understands concepts general-purpose APM tools ignore: token usage, model parameters, prompt and completion pairs, and evaluation scores.
Three capabilities sit on top of tracing. Evaluations run on real traces, including LLM-as-a-Judge scoring, experiments, and datasets. Prompt management gives you versioned prompts and experiments against them. Dashboards and alerts cover cost, latency, volume, and quality, with notifications when a metric crosses a threshold.
Two practical details matter when you are choosing. Langfuse is open source and can be self-hosted, which is the deciding factor for teams with data residency or cost constraints. And the SDKs send tracing data asynchronously: events are queued locally and flushed in batches, so your application’s response time is not affected.
Helicone: A Gateway That Logs on the Way Past
Helicone takes a different route. Instead of instrumenting your code, it sits between your application and the model provider. Its AI Gateway is an OpenAI-compatible API, so you point the OpenAI SDK at a different baseURL and keep the rest of your code unchanged. The gateway exposes more than 100 models across OpenAI, Anthropic, Google, Vertex, and Groq.
That gateway approach buys reliability features. Helicone’s documentation describes automatic fallbacks when a provider is down, load balancing when rate limits hit, and unified billing so you hold credits in one place instead of managing keys for every provider. You pay what the provider charges, with the gateway documenting zero markup on those credits. You can also bring your own provider keys and keep Helicone in observability-only mode if you would rather keep billing relationships in-house.
For debugging and cost work, every request is logged with its cost, latency, and errors, and the platform documents breakdowns by user, feature, or any custom dimension, so a surprise bill can be traced to the exact endpoint that caused it. Helicone also positions itself around edge deployment, stating it keeps the proxy overhead under 50 milliseconds.
Side by side at a glance
| Dimension | LangSmith | Langfuse | Helicone |
|---|---|---|---|
| How it attaches | SDK and tracing projects | SDK integrations | OpenAI-compatible gateway |
| Strongest for | LangChain and LangGraph agents | Evaluations and prompt versioning | Multi-provider routing and cost control |
| Deployment | Managed platform | Open source, self-hostable | Managed platform |
| Notable strength | Runs, traces, threads, trajectories | LLM-as-a-Judge, datasets, dashboards | Fallbacks, load balancing, unified billing |
Choosing a Tool
If your application is built with LangChain or LangGraph, start with LangSmith. The data model, the one-flag setup, and the run and trace hierarchy are designed for exactly that stack, and the trajectory view solves the “what did the agent actually do” question faster than anything else in this category.
If you need to own your data, run evaluations against real traffic, and manage prompts as versioned artifacts, Langfuse is the better fit. The asynchronous SDK means observability does not tax your latency budget, and self-hosting removes the pricing conversation entirely.
If your problem is provider reliability and a bill you cannot explain, Helicone fits best. The gateway gives you fallbacks, rate-limit headroom, and one place to see what each feature costs.
These are not mutually exclusive choices. A common setup is Helicone in front for routing and cost, with LangSmith or Langfuse receiving traces from inside the app for agent-level debugging. Decide by picking the failure you are most worried about, because that is the one each tool is best equipped to answer.
A 30-minute setup checklist
Whichever tool you pick, run the same sequence so you get real data instead of an empty dashboard.
One, instrument one endpoint. Pick the route with the highest traffic and the clearest pass or fail result. Do not start by instrumenting everything.
Two, send a deliberate test request. Include one request you want to fail, so you can confirm the trace view shows what you expect.
Three, read the trace end to end. Prompt, response, token usage, latency, and any tool calls, all in one record.
Four, check the cost breakdown. Confirm tokens and price match your provider invoice before you trust the numbers on a dashboard.
Five, set one alert. A single threshold, such as latency or error rate, tells you the pipeline is alive without flooding anyone.
Six, revisit weekly. Compare traces, look for the request that costs the most, and change one thing at a time. Observability only pays off when someone reads it.